Wednesday, September 3, 2008

I am merely using this information to understand, on a personal level, how certain parts of the stock(s) work. The information below is from Investopedia.com. You can find it here. http://www.swing-trade-stocks.com/stock-chart-volume.html

Momentum, is perhaps the simplest and easiest oscillator to understand and use. Momentum is the measurement of the speed or velocity of price changes. In "Technical Analysis of the Financial Markets", John J. Murphy explains:

"Market momentum is measured by continually taking price differences for a fixed time interval. To construct a 10-day momentum line, simply subtract the closing price 10 days ago from the last closing price. This positive or negative value is then plotted around a zero line. The formula for momentum is:
M = V - Vx
Where V is the latest price, Vx is the closing price x number of days ago."

What it Measures
Momentum measures the rate of the rise or fall in stock prices. From the standpoint of trending, momentum is a very useful indicator of strength or weakness in the issue's price. History has shown us that momentum is far more useful during rising markets than during falling markets; the fact that markets rise more often than they fall is the reason for this. In other words, bull markets tend to last longer than bear markets. (For more, see Momentum Trading with Discipline.)

Technicians use a 10-day time frame when measuring momentum. You will see the zero line in the chart below. If the most recent closing price of the stock is more than the closing price 10 trading days ago, the positive number (from the equation) is plotted above the zero line. Conversely, if the latest closing price is lower than the closing price 10 days ago, the negative measurement is plotted below the zero line.

By measuring the differences of prices over a set period of time, we can start to recognize the rates at which the stock price is rising or falling. Momentum will help you recognize trendlines. Distinct trendlines develop as the stock price increases; a rising momentum plot line above zero indicates that an uptrend is firmly developing. A plot line starting to level-off indicates to technicians that the latest price of the stock is about the same as it was 10 days ago; thus, the velocity of the trend is slowing. The reversal is also true. (For related reading, see Riding The Momentum Investing Wave.)

It is important to understand that when the momentum indicator slides downward below the zero line and then reverses in an upward direction, it does not mean that the downtrend is finished. It merely means that the downtrend is slowing down. The same is true for the plotted momentum above the zero line.
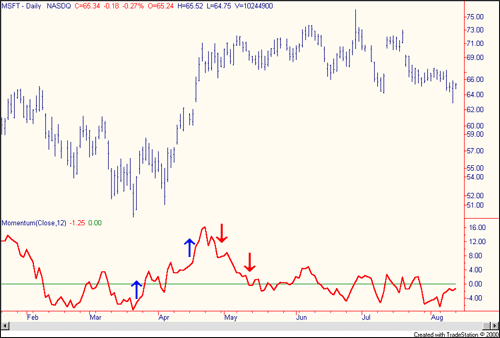
In the graph plotting Microsoft stock data from Feb 2001 to Aug 2001, a very clear trend develops in mid March. Over the next five weeks, the stock price moves in an extremely strong momentum from about $50 to $72-$73. A two-line simple moving average over the same period of time would show a clear crossover, indicating a strong buy entry point.

Conclusion
It is important to understand that momentum, albeit a very good indicator for determining price movement and subsequent trend development, must be used with other indicators to be an effective buy/sell indicator.

by Investopedia.com Staff

Tuesday, August 5, 2008

Analyzing What I Have Read So Far.

These posts will be a day short but what I have learned from reading the Series 65 examination book so far is that broker-dealers like to make money off transactions between investors. They are the middle men, whereas where my field of study is (investment adviser) we only receive a fee for our advice, for a flat fee or an hourly rate, or for a small percentage (1%) of the client's assets being invested. Investors provide capital to companies looking to make money. The investor or underwriters buy a share of the company (let's say 20%) and this helps the company gain money. These positions of ownership are called equity securities. A good way to understand this would be that a home owner has equity and ownership, and an investor has equity and ownership as well.

So when investors buy shares from a company looking to enlarge or expand, they are providing capital to a corporation (TDA as an example?) in exchange for equity securities. Then, if the business grows, the original investment firm will then sell shares to other investors, making a large profit for themselves and for the company, because as each share is bought, the price likely to skyrocketing as business should be taking off. This would go down the line in a perfect world. The investors buying up shares from the originating investor would then also make money if the price of the shares continues to climb. However, this can go either way. A company could take a nose dive if people are not interested in their product, or if the company is unionized and workers go on strike, the cost of oil goes up, etc. You get the idea.

Now for the "FUN" part! The stock that is being sold must be registered with the Securities and Exchange Commission. (SEC) This is called a prospectus. They also must print annual (10K) and quarterly (10Q) statements so that the secondary investors buying shares know whether or not the company will continue to grow. This tells investors whether to invest in the company or stay invested because the company is about to grow tremendously. Also, the company now must hire a lawyer and an accountant to work on the 10K and 10Q statements, because this is very important to investors that are buying up shares, and because it is literally the law for them to do so.

Now, an investment firm is in the primary market and they make money back directly then give that money to a company and the securities the company buys are promised to be paid back. The secondary market is where trades are made back and forth - no money is made up front, however, you can sell your trade if you feel that it is getting too hot / cold for you.

Brokers work in the secondary market. They sell investors shares and make a profit for themselves, so they make money regardless of whether the investor makes a dime.